Our core purpose ?
Enhancing yours !
Our motto is in our name
Our essence lies on the foundation of collaboration : merging our skills with yours to amplify your purpose
Our expertise, our excellence, our high standards and our desire to expand your impact.
« your whY » is where your core purpose lies, « your strengths and your values are » gathered
Our expertises

Transformation
Whether digital, sustainable or organizational, transformation is above all a strategic process, designed to reinvent the company, optimise its performance and meet the growing expectations of its customers.

Consulting
Our vision of consulting is based on two beliefs : dedication to our clients’ strategy and its core purpose

Support
Axys provides you with dedicated, tailor-made support to meet the challenges of your business.
Axys awarded the Gold Prize at the “Grand Prix Syntec Conseil” 2024
Axys won the Gold Award, the highest distinction in the Syntec Conseil Grand Prix, in the Organizational Transformation category for its support of the Colissimo Customer Service.
An ambitious and disruptive project that places symmetry of attention at the heart of the Customer Service transformation.
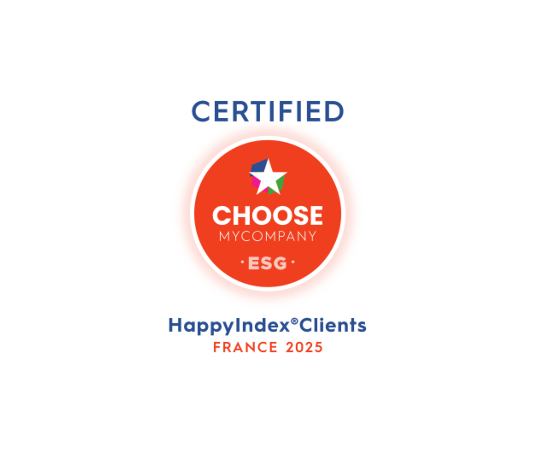
Axys consulting firm certified HappyIndex® Clients 2025
With a score of 4.44/5 and a 92% favorable opinion rate in the 2025 campaign, Axys confirms its commitment to providing an exemplary customer experience.
This recognition, awarded by HappyIndex® Clients, the leading ESG corporate reputation program, reflects the satisfaction and confidence of our partners.

Do you have a project for us?
Transforming your organisation is a complex challenge that requires strategic vision, specific skills and unfailing responsiveness.
Axys is committed to meeting your needs as quickly as possible and providing you with customised solutions tailored to your specific challenges.
Join the Axys family
Joining Axys means becoming part of a group where we are proud to promote diversity and equal opportunities within our teams. Our differences are our strength!
Are you looking for a new challenge? We offer you an enriching candidate experience based on Interaction and openness. Axys is also an inclusive recruitment process that promotes difference and diversity.